Site overview: domain strength, traffic and rankings
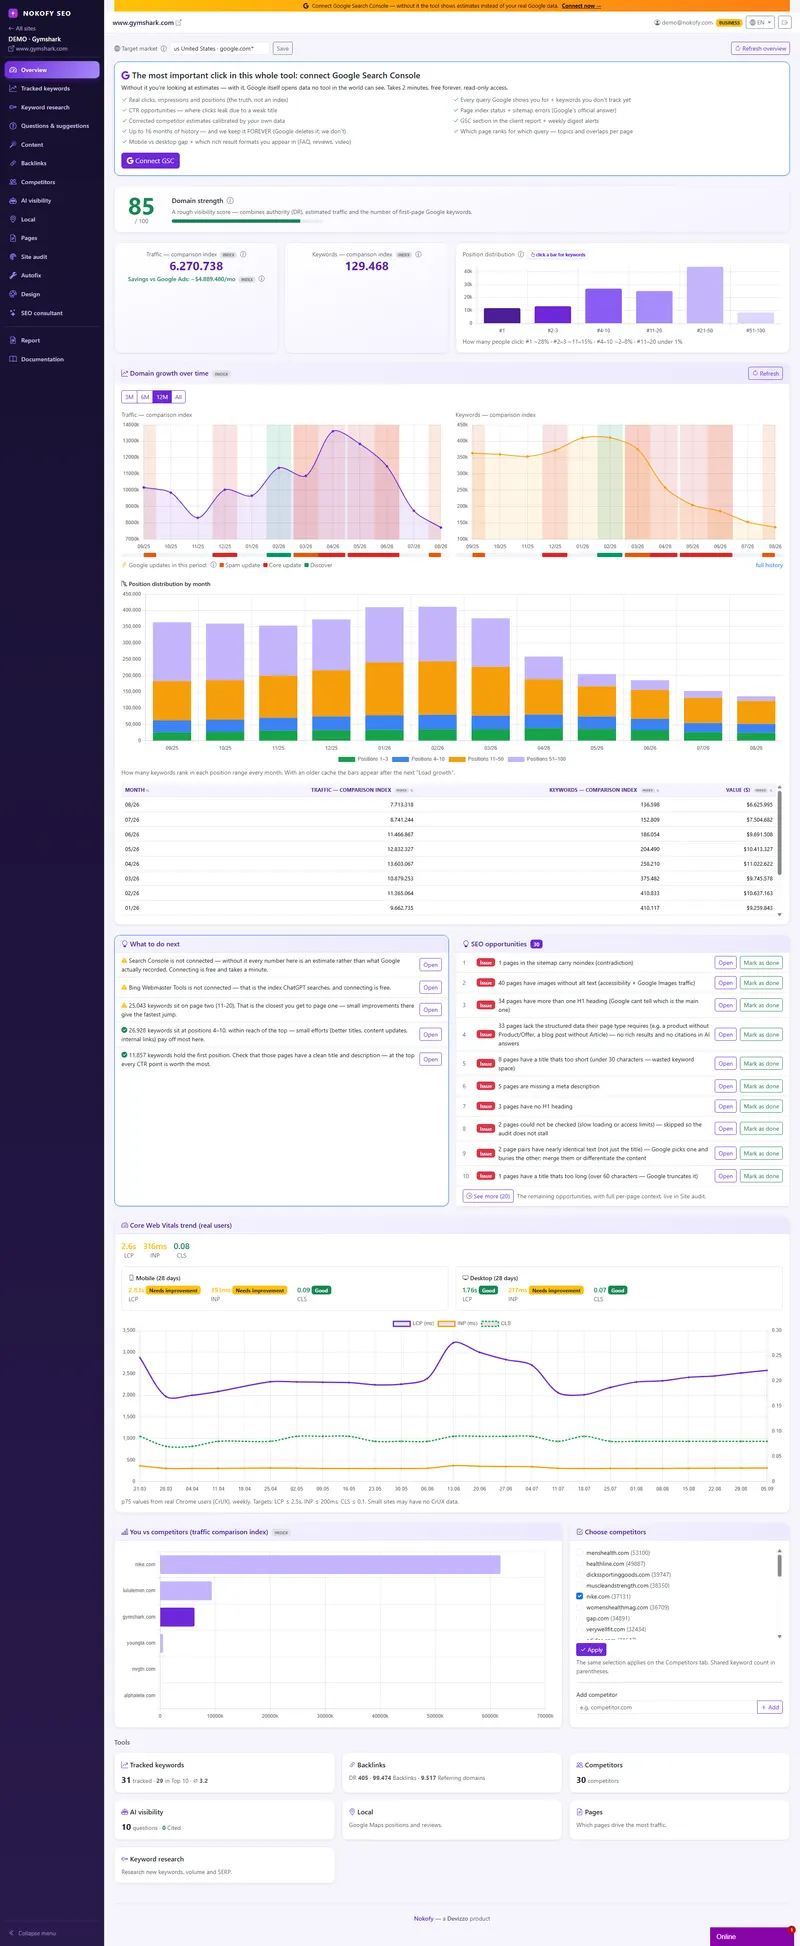
Everything about your site on one page — and what to do next. Domain strength, traffic, positions by range, real clicks and impressions from search, site speed and competitors. All on one screen, and at the bottom a list of concrete tasks the tool assembles from your own data.
- 0–100
- the range domain strength moves in
- 16
- months of Search Console history
- 28%
- of clicks go to the first result
The problem: too much data, not one answer
You open a foreign tool and thirty reports greet you. You open Search Console and get a table with a thousand rows. Each of them tells you one true thing about your site, and none of them tells you what you actually want to know: are you better off than three months ago, and what specifically should you do on Monday morning.
There’s a second problem, discussed less often. Tools display „estimated monthly traffic“ as if it were measured, even though nobody on earth measures somebody else’s site. For Serbian and other smaller languages those estimates routinely come out below reality. When your tool says one number and Search Console shows you several times more, you lose faith in the whole thing — and rightly so.
So the overview does two things that are rarely done together: it puts everything on one screen, and it says honestly what is measured and what is estimated.
How it works
Three index cards at the top. Domain strength is a single number from 0 to 100 showing how much your domain carries, calculated from three things: 45 percent link authority, 30 percent traffic and 25 percent keywords sitting on the first page. Next to it, traffic as a comparative index, with a measure that’s easy to explain to a client — what it would cost to buy that same traffic through ads. The third card shows how many keywords touch you in search at all and how that’s changing. Under each card sits the real number from Search Console, when it’s connected.
Position distribution. A bar view of how many of your keywords sit at which position, with a legend explaining why it matters: first place takes around 28 percent of clicks, second and third around 11 to 15 percent, places four to ten between 2 and 8 percent, and eleven to twenty under 1 percent. Click a bar and exactly those keywords open up.
The „Measured“ block. Once you connect Search Console, a block enters the overview in which no figure is an estimate: clicks, impressions, average position and CTR. You pick a period of 28 days, 3 months, 12 or 16 months, and each is automatically compared with the previous one. Alongside come the breakdowns that actually change decisions — by device, by country, and by whether people look for you by name or find you without knowing you exist.
The distinction other tools don’t bother with: measured versus comparative index
There are two kinds of number on the screen and you are always told which is which.
Measured is data from Search Console and Bing — what the search engine actually recorded on your site. Nothing is more accurate than that.
The comparative index is an estimate from an independent database. Its value isn’t in hitting the exact number of visits, but in being the same yardstick for every domain — yours, your competitor’s, and the one you’re only considering. That makes it excellent for comparison and for trends. Its weakness is known and we don’t hide it: for smaller languages it routinely underestimates the real figures. The same weakness exists in the big foreign tools, only there the estimate is shown without the caveat.
No tool on earth knows the real traffic of somebody else’s site. The difference is that we show the index and the truth side by side, so you always know what you’re looking at.
A practical rule: when deciding about your own site, look at what’s measured. When comparing yourself with competitors, look at the index — because for somebody else’s site, nobody has measurements.

What you get
A „What do I do next“ list. At the bottom of the overview sits the reason the whole screen exists: concrete tasks pulled from your own data, not general advice from a book. Keywords at positions 4–15 that are within reach of the first page, cannibalisation where two of your pages fight over the same query and both lose, lost backlinks, spam domains, questions in your industry that AI answers without you, and speed measurements sitting in the red.
SEO opportunities sorted by type. A problem means something is broken, optimise means it works but could be better, and the third type means you can take a richer display in the results. You mark each as done, so the list stays clean.
Competitor comparison and a Bing panel. The comparative index for you and your competitors, calibrated with your real data when Search Console is connected, plus how much of the visibility in your topic you occupy. The Bing panel shows how many of your pages are in the Bing index — a small number next to Google, but increasingly important, because it’s through the Bing index that your content shows up in AI answers.

A real example
A marketer at a company selling heating equipment opens the overview for the first time. Domain strength is 31, and the tallest bar in the position distribution sits exactly on the fourth-to-tenth range, where a click is worth between 2 and 8 percent. He clicks the bar and gets nine keywords.
In the „Measured“ block he sees that those same keywords have 14,000 impressions a month and 380 clicks, so a CTR under 3 percent. He also sees that 70 percent of impressions come from mobile, and that his response-to-tap measurement is in the red on mobile specifically. The task list holds three items: nine keywords at positions 4–15, cannibalisation across two pages on the same topic, and that response measurement.
He walks into the meeting with one sentence: what we have replaces about 300 dollars of ads a month, and three changes could lift nine keywords from tenth to third place. That’s a conversation that ends in a decision, not in another report.
Who it’s for
A business owner — one number that rises or falls and one list of what to do. You don’t have to learn to read reports.
A marketer inside a company — savings against ads, and the split between branded and non-branded, are two measures that defend SEO in front of someone looking at the budget.
An agency or freelancer — the same screen and the same yardstick for every client. The competitor comparison is a ready-made slide for the meeting.
An online shop — the position distribution shows which categories are within reach of the first page, and the device breakdown plus speed measurements say whether you’re losing buyers on mobile.
Honestly: until you connect Search Console, the whole overview runs on estimates and the numbers will probably be lower than reality — especially in Serbian. That’s not a calculation error but the nature of a comparative index, which is why we call it that. Connecting is free and takes a couple of minutes, and from that moment a measured number sits next to every estimate.
Frequently asked questions
Why does estimated traffic differ from Search Console?
Because they are two different things. Search Console is measured — the search engine recorded it on your site. The comparative index is an estimate from an independent database and, for smaller languages, it usually comes out lower. We show them side by side and always say which is which, instead of selling you an estimate as the truth.
How is domain strength calculated?
From three parts: 45 percent link authority, 30 percent traffic and 25 percent first-page keywords. The number runs from 0 to 100, and is most useful as a trend — whether it climbs month after month.
What does „Savings vs Google Ads“ mean?
What it would cost you to buy that same traffic through ads. It's calculated from your position, the search volume for that keyword and the cost per click. It's the easiest way to explain to someone who doesn't follow SEO what you've actually gained.
Does the overview work without Search Console connected?
It works, but then you're looking at estimates. The „Measured“ block only appears once you connect the account — and connecting is free and takes a couple of minutes.
What are Core Web Vitals?
Three measurements Google uses to judge how pleasant a page is to use: how quickly the main content appears (LCP, target under 2.5 seconds), how quickly the page responds to a tap (INP, target under 200 milliseconds) and how much the content shifts while loading (CLS, target under 0.1). We show them from real visits to your site, not from a lab test.
Can I export all of this as a report?
Yes. The whole overview comes out as a report with your name and your colour, without our mark on it, ready to go to a client.
Works together with
The tools in Nokofy build on each other — here is what naturally goes with this one.
Search Console and Bing
Until they're connected you're looking at estimates. Once connected, you're looking at measurements.
More →Reports
Everything in the overview goes into a report with your brand, with no preparation.
More →Tracked keywords
The keywords at positions 4–15 from the distribution are the ones you follow week by week.
More →Add a site and see your first overview
Within minutes you have domain strength, position distribution and a list of tasks sorted by importance. Connect Search Console and the list gets sharper still — and connecting is free.
No card · No contract · Cancel anytime